■分数関数
反比例のグラフ(y = a/x, a ≠ 0)を分数関数という。
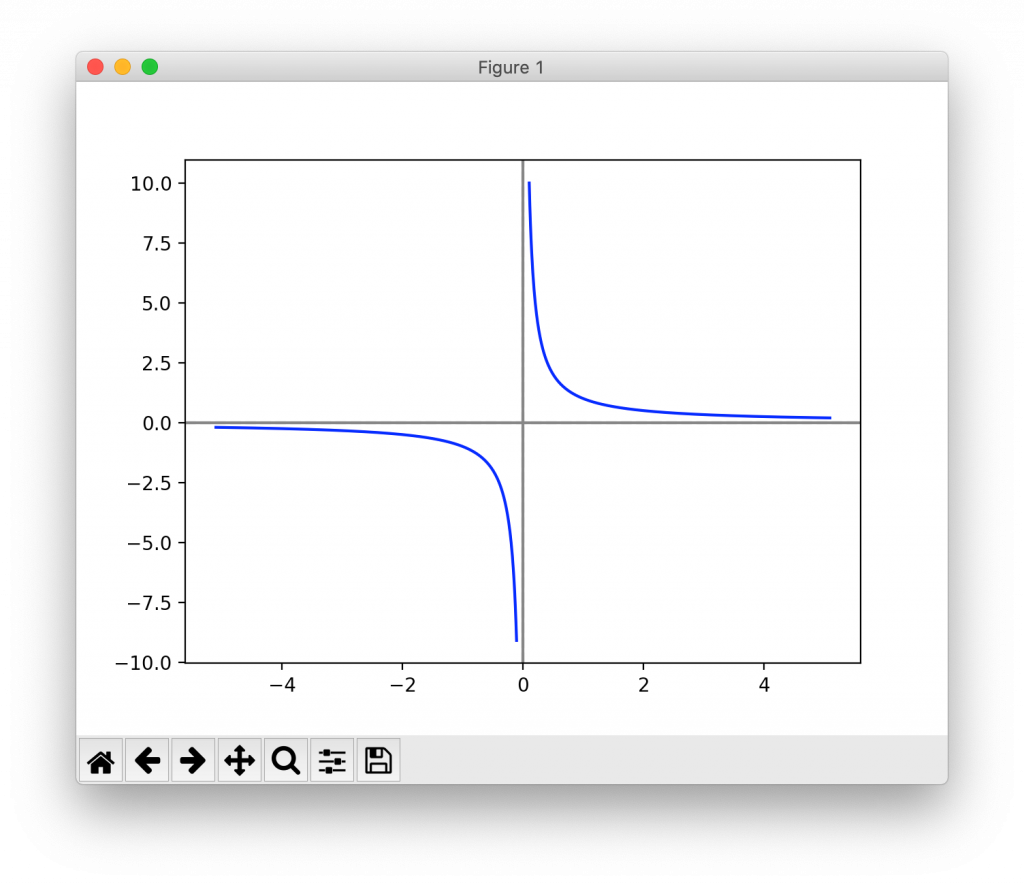
▼y = 1 / x
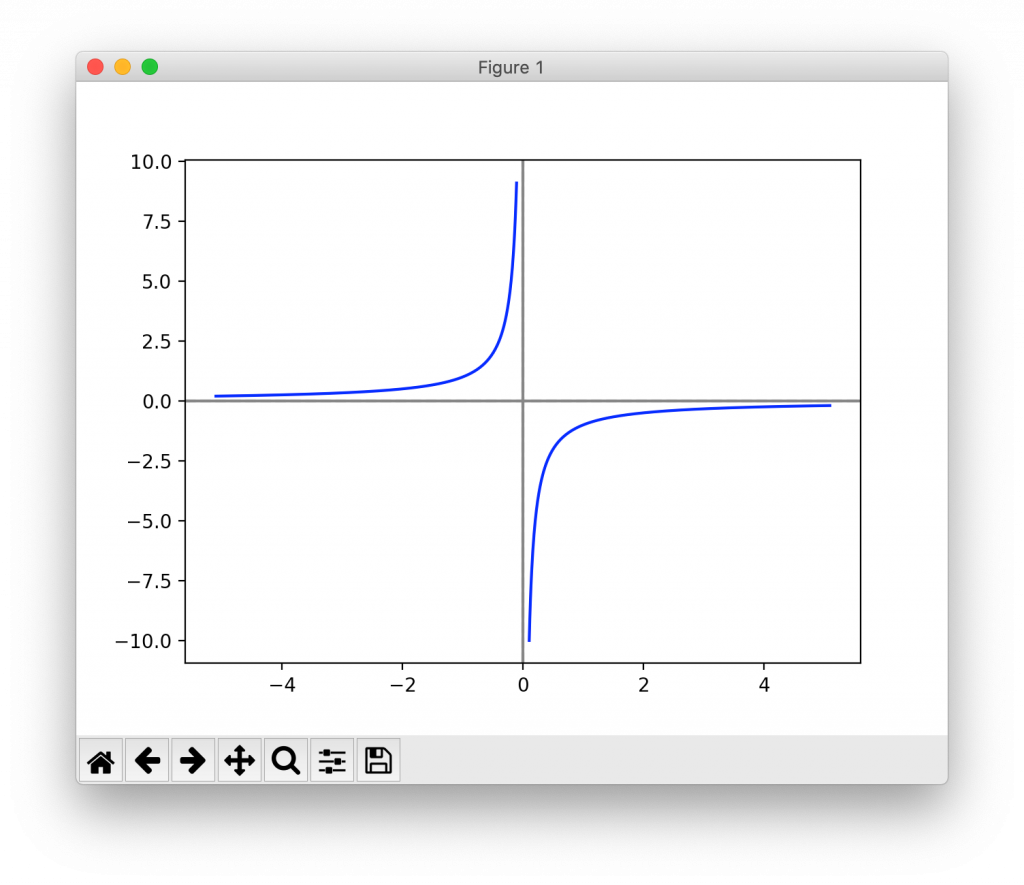
▼y = – 1 / x
■分数関数の一般形
以下の式が分数関数の一般形である。
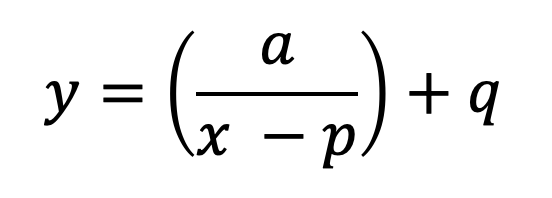
このとき、
漸近線:x= p 、y = q
点(p, q)に関して対称の双曲線を描く
■例題
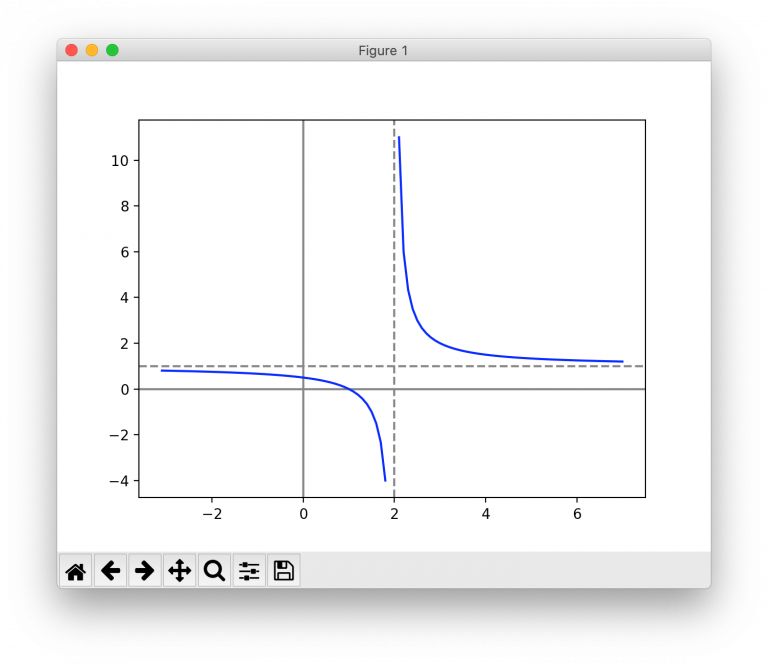
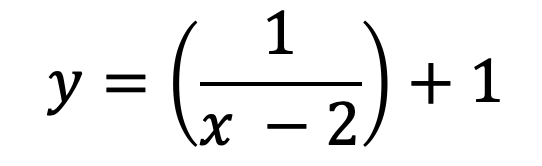
以下の分数関数を図示する。
■サンプルコード
# -*- Coding:UTF-8 -*-
import numpy as np
from matplotlib import pyplot as plt


def MakeGraph(a:int, p:int, q:int) -> None:
    ########## グラフにx軸,y軸(0)を図示 ##########
    # 補助線(0)を作成 [axhline:水平 axvline:垂直]
    plt.axhline(y = 0, color = "gray")
    plt.axvline(x = 0, color = "gray")
    ############################################

    ########## グラフに漸近線を点線で図示 ##########
    # 補助線(0)を作成 [axhline:水平 axvline:垂直]
    plt.axhline(y = q, color = "gray", linestyle='dashed')
    plt.axvline(x = p, color = "gray", linestyle='dashed')
    ############################################

    ########## 分数関数をグラフに図示 ##########
    """
    分数関数のxを漸近線 x = p について、
    0.1間隔でそれぞれ
    双曲線①:(p + 0.1)     < x < (p + 0.1) + 5
    双曲線②:(p - 0.1) - 5 < x < (p - 0.1)
    の範囲を指定
    """

    # 双曲線共通の設定(xの値を0.1の間隔で設定するための変数)
    xinterval = 0.1

    # 双曲線①
    xmin_1 = p + 0.1
    xmax_1 = xmin_1 + 5
    x1 = np.arange(xmin_1, xmax_1, xinterval)

    # yを算出
    y1 = a/(x1 - p) + q

    # グラフを作成
    plt.plot(x1,y1,color = "blue")

    # 双曲線②
    xmax_2 = p - 0.1
    xmin_2 = xmax_2 - 5
    x2 = np.arange(xmin_2, xmax_2, xinterval)

    y2 = a/(x2 - p) + q

    # グラフを作成
    plt.plot(x2,y2,color = "blue")

    ########################################


    # グラフを表示
    plt.show()


# メイン処理
if __name__ == '__main__':
    # y = 1/(x - 2) + 1
    a = 1
    p = 2
    q = 1
    MakeGraph(a, p, q)
■実行結果
コメント