■サンプルデータ
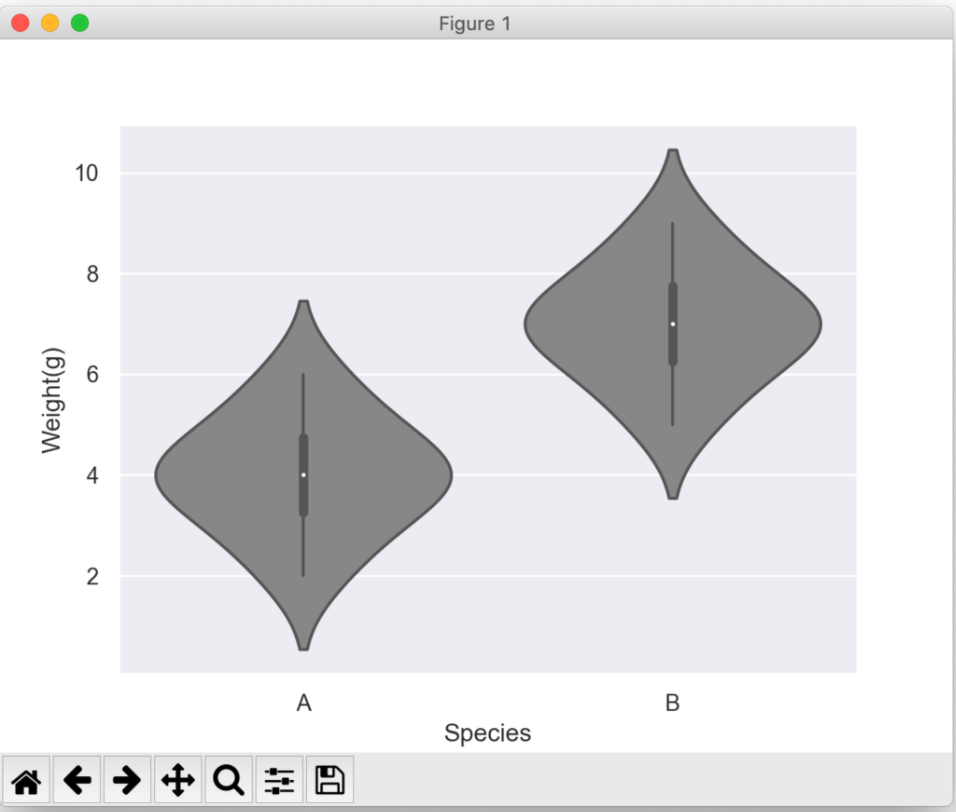
以下の2つの品種に関してバイオリンプロットを作成する。
・ファイル名
SpeciesData.csv

■バイオリンプロット
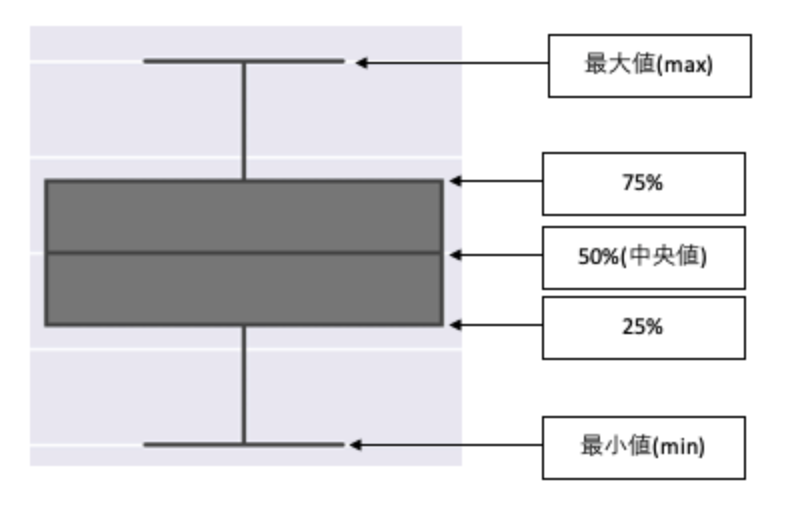
数値データを描画する手法の一つであり、箱ひげ図の両脇に90度回転させたものに近い。
今回はpandasでcsvファイルを取得し、以下の3点を出力する。
①csvファイル一覧を表示
②統計量を出力(groupby(カラム名).describe()を使用)
③バイオリンプロットを表示(matplotlibのpyplotとseabornを使用)
・サンプルコード
# -*- Coding: UTF-8 -*-

import pandas as pd
from matplotlib import pyplot as plt
import seaborn as sns

# csvファイル読み込み
SpeciesData = pd.read_csv("SpeciesData.csv")

# 読み込んだcsvファイルを表示
print(SpeciesData)

# 品種ごとの統計量を出力(補足情報)
print(SpeciesData.groupby("Species").describe())

# グラフのデザイン変更
sns.set()

# バイオリンプロットを作成
sns.violinplot(x = "Species", y = "Weight(g)", data = SpeciesData, color = 'gray')

#バイオリンプロットを表示
plt.show()
・実行結果
   Species  Weight(g)
0        A          2
1        B          5
2        A          3
3        A          3
4        B          9
5        A          4
6        A          4
7        B          6
8        B          8
9        A          4
10       A          4
11       A          5
12       B          6
13       B          8
14       B          7
15       A          5
16       B          7
17       A          6
18       B          7
19       B          7

        Weight(g)
            count mean       std  min   25%  50%   75%  max
Species
A            10.0  4.0  1.154701  2.0  3.25  4.0  4.75  6.0
B            10.0  7.0  1.154701  5.0  6.25  7.0  7.75  9.0


コメント