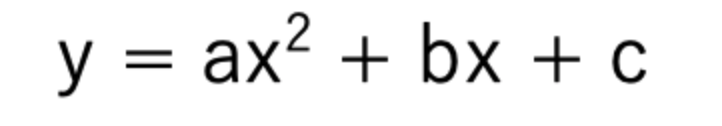
■2次関数
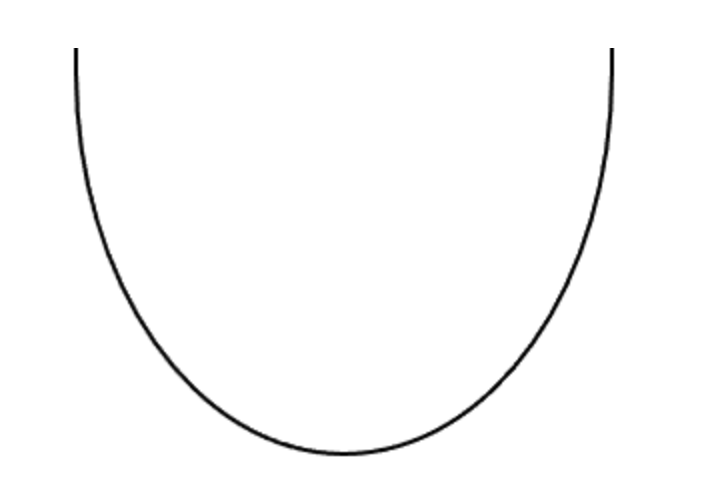
a > 0 の時、グラフは下に凸(とつ)
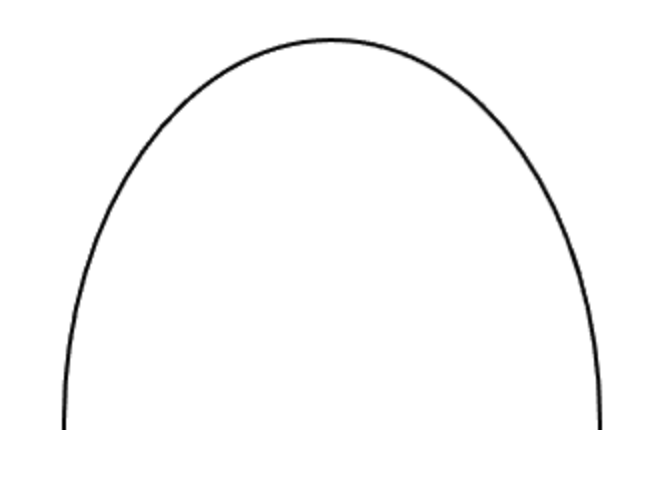
a < 0 の時、グラフは上に凸(とつ)
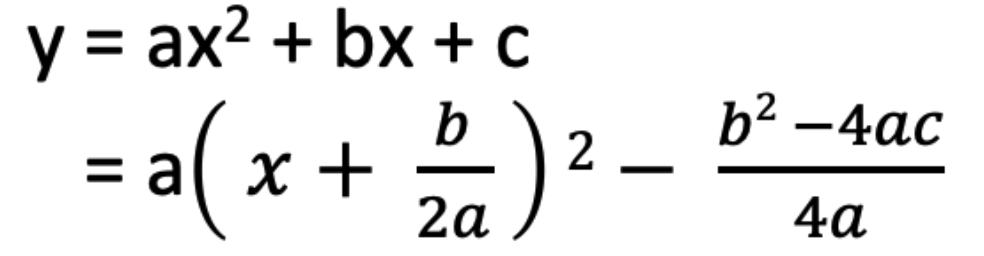
■頂点座標を算出
2次関数について平方完成をすると・・・
①

このとき
・頂点座標(p, q)
・軸の方程式: x = p
が成り立つ。
また、平方完成は以下のように表すことができる。
②
①・②より頂点座標(p, q)は
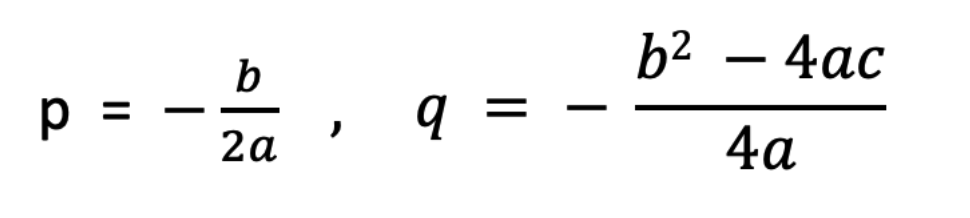
となる。
■例題
頂点(1, -3)と点P(-1 5)を通る2次関数を求める。
■サンプルコード
# -*- Coding: UTF-8 -*-
import numpy as np
from matplotlib import pyplot as plt

# 頂点座標と任意の点Pから2次関数を決定する関数
# 平方完成の y = a(x - p)**2 + q を使用
# 引数     : 頂点座標(p, q), 点P(x1, y1)
# 戻り値   :y = a(x - p)**2 + q の[a]
def DecisionQuadraticFunc(p:int, q:int, x1:int, y1:int) -> int:

    # aの値を算出
    a = (y1 - q) / ((x1 - p) ** 2)

    return a

# グラフを作成する関数
# 引数   : y = a(x - p)**2 + q の[a]・頂点座標(p, q)・点P(x1, y1)
def MakeGraph(a:int, p:int, q:int, x1:int, y1:int):

    ########## 2次関数をグラフに図示 ##########
    # 2次関数のxを便宜上、0.1間隔で -3 < x < 5 の範囲を指定
    xmin = -3
    xmax = 5
    xinterval = 0.1
    x = np.arange(xmin, xmax, xinterval)

    # yを算出
    y = a * (x - p) ** 2 + q

    # グラフを作成
    plt.plot(x,y)
    ########################################

    ########## グラフにx軸,y軸から頂点までを点線で図示 ##########
    # 補助線を点線で作成 [hlines:水平 vlines:垂直]
    plt.hlines([q], 0, p, "gray", linestyles='dashed')
    plt.vlines([p], 0, q, "gray", linestyles='dashed')
    #######################################################

    ########## グラフにx軸,y軸から点Pまでを点線で図示 ##########
    # 補助線を点線で作成 [hlines:水平 vlines:垂直]
    plt.hlines([y1], 0, x1, "gray", linestyles='dashed')
    plt.vlines([x1], 0, y1, "gray", linestyles='dashed')
    #######################################################


    ########## グラフにx軸,y軸(0)を図示 ##########
    # 補助線(0)を作成 [axhline:水平 axvline:垂直]
    plt.axhline(y = 0, color = "gray")
    plt.axvline(x = 0, color = "gray")
    ############################################

    # グラフを表示
    plt.show()


# メイン処理
if __name__ == '__main__':
    # 頂点(1, -3)と点P(-1 5)を通る2次関数を求める
    p = 1
    q = -3
    x1 = -1
    y1 = 5

    # 頂点座標と任意の点Pから2次関数を決定する
    a = DecisionQuadraticFunc(p, q, x1, y1)

    print('二次関数:y = ' + str(a) + '( x - ( ' + str(p) + ' )) ** 2 + ( ' + str(q) + ' )')

    # グラフの作成
    MakeGraph(a, p, q, x1, y1)
■実行結果
二次関数:y = 2.0( x - ( 1 )) ** 2 + ( -3 )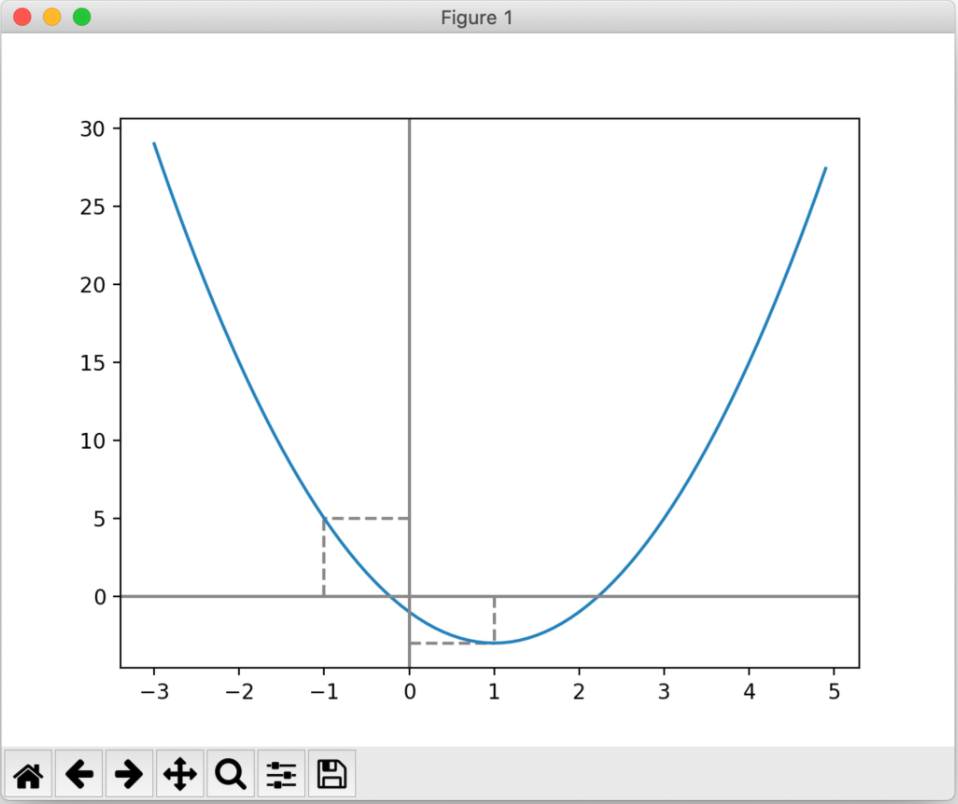
コメント